K-means clustering
K-Means clustering is one of the most intuitive clustering techniques due to the simplicity and elegance of its design.
The algorithm is initiated by standardizing the available data along each dimension (or variable), so that the mean is 0 and the standard deviation is one for each dimension. This is important to avoid a bias in the influence of the clustering outcome to dimensions / variables with a range of larger absolute values.
We then set a number of expected clusters. This is the only piece of information aside from the data themselves, and may be a difficult choice. It is best to consider the context of your data to get some idea of the likely number of existing clusters, but some further notes on optimizing the number of expected clusters will be given further along.
We then initialize random vectors of values, which represent our initial guess for the cluster means. The number of vectors corresponds to the number of expected clusters we just set, and the dimensionality of the vectors is equal to the dimensionality of our data. The random values can be drawn from the range of standardized values in the given data.
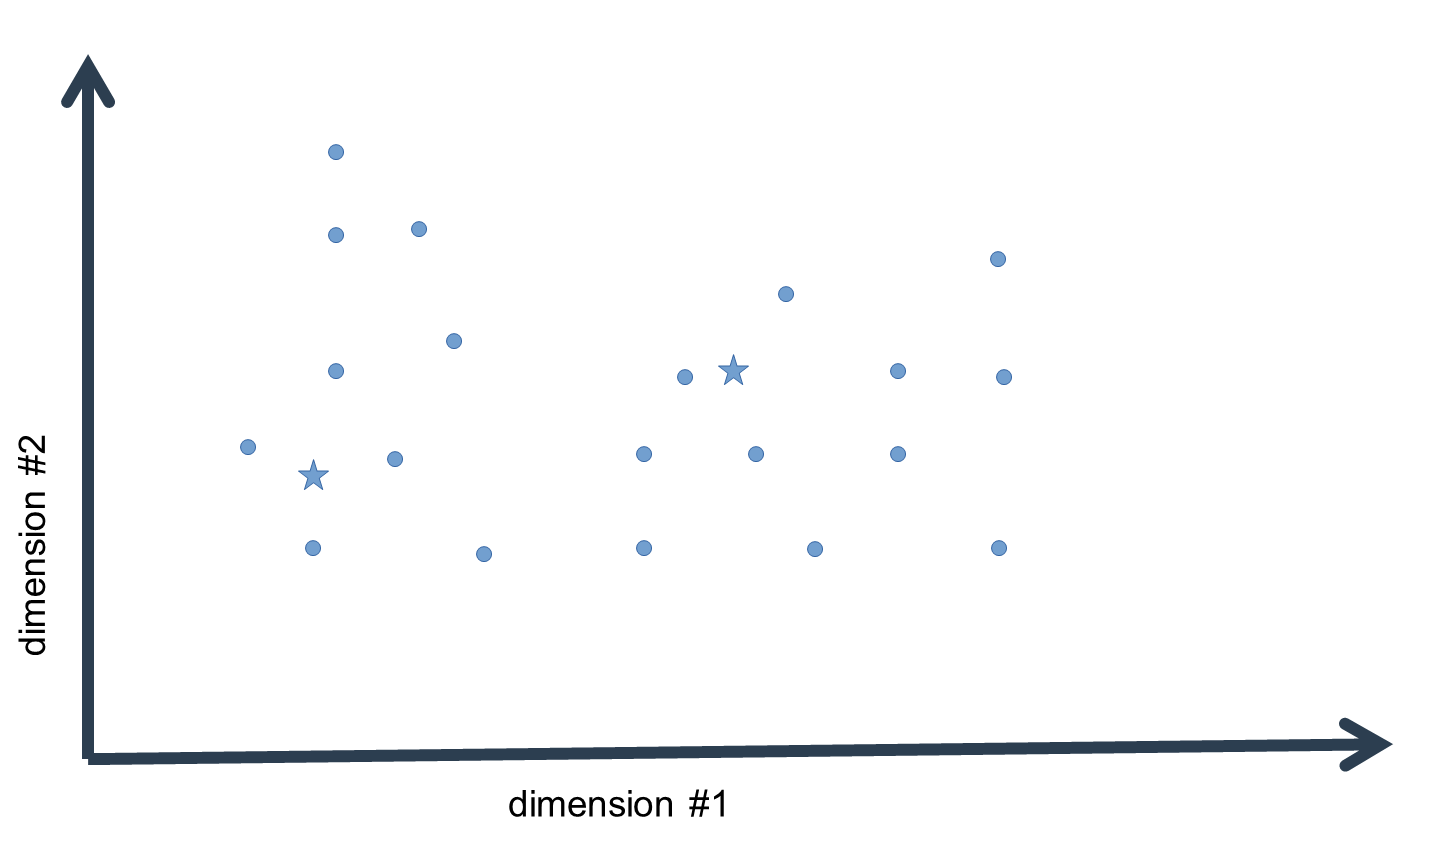
For each data-point (i.e. a vector with n elements corresponding to n dimensions) we then compute the absolute or squared distance to every cluster mean. Since we usually work with data of a dimensionality > 1, we must compute the sum of distances over the n dimensions. Thus, we find out how distant each data-point is to our initial guess values for the cluster means in the n-dimensional space.
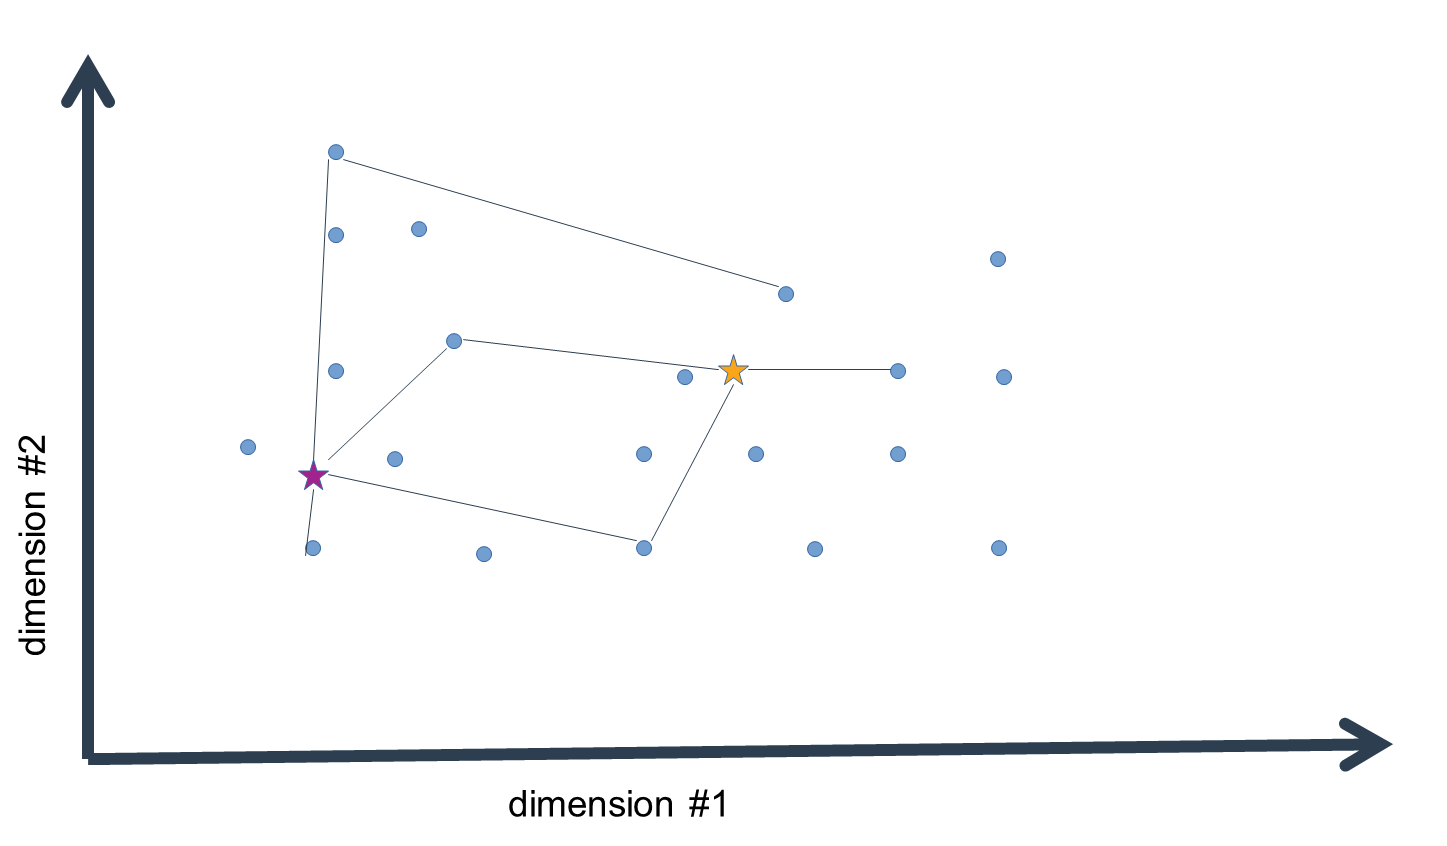
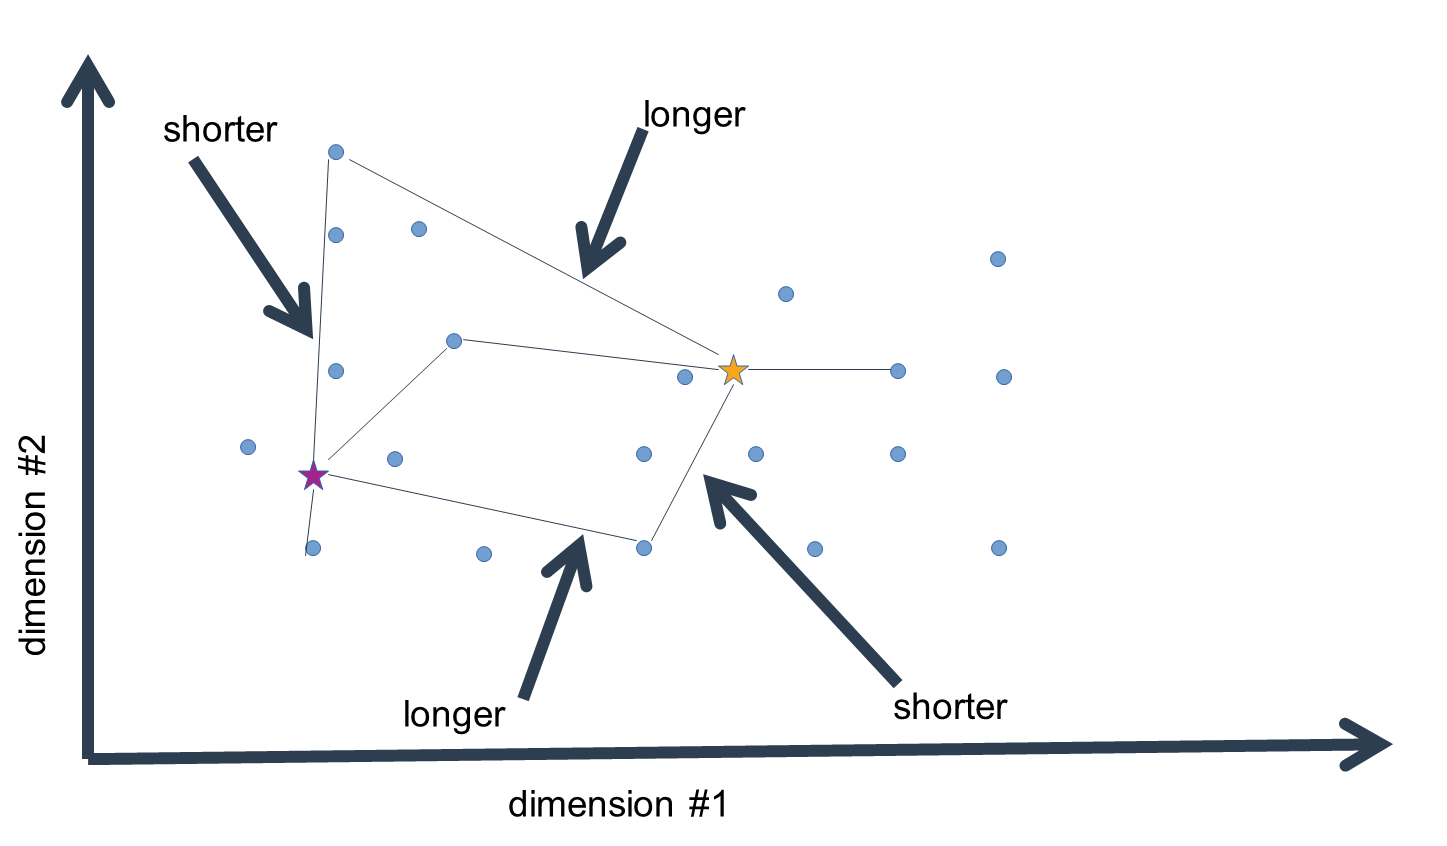
We then assign each data-point to the cluster mean that is closest in distance, i.e. the "arg min" over all distance values. What we get in the end is list of indices of cluster means closest to each data-point.
Now, this is not yet the final step in the clustering procedure. Having assigned the data to our initial guess values of cluster means, we have essentially clustered the data, but given that the means were no more than estimates, these clusters are probably pretty wrong. We now compute the n-dimensional mean of all the data-points assigned to a given cluster mean to generate a replacement estimate of the cluster means. That is, for every dimension, we calculate the mean value, which gives us an n-dimensional vector of mean values, i.e. an n-dimensional mean.
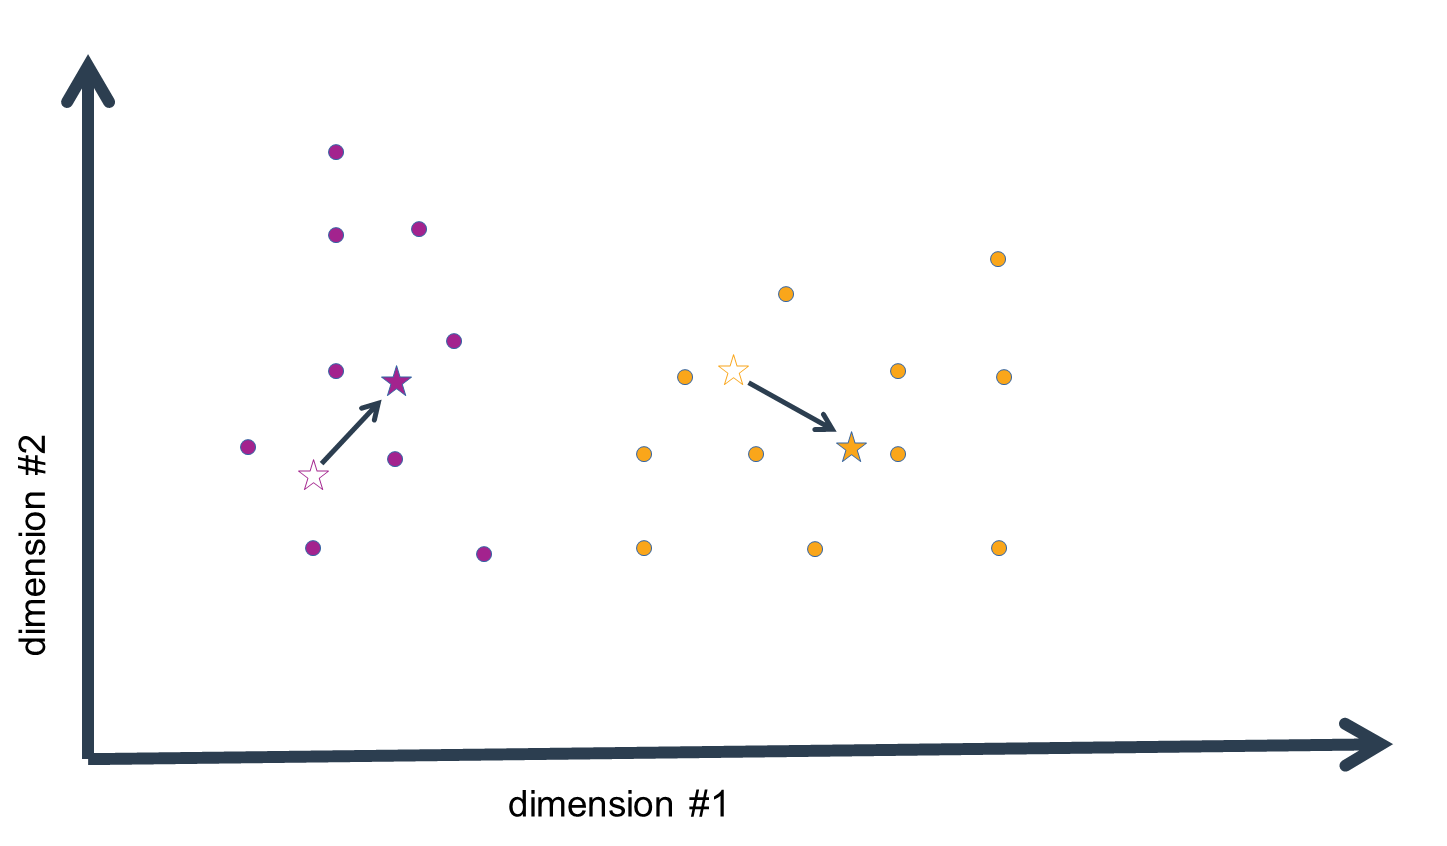
We now repeat the above steps: compute the distances of the data-points to these new cluster-mean estimates,
assign the data-points to the cluster means of closest distance, and calculate the new n-dimensional mean
for all the data-points assigned to a cluster-mean estimate. This procedure is iterated as long as the
cluster-mean estimates do not change a lot anymore. We could set some threshold value for this, or observe
the summed differences between cluster mean estimates between adjacent iterations. These differences will
likely drop strongly in the early iterations, and then move asymptotically towards zero. At this point,
the iterations can be stopped, and we have obtained very close estimates of the true cluster means (which
we will never truly know, since we usually only work with a sample of data, not the entire "population").
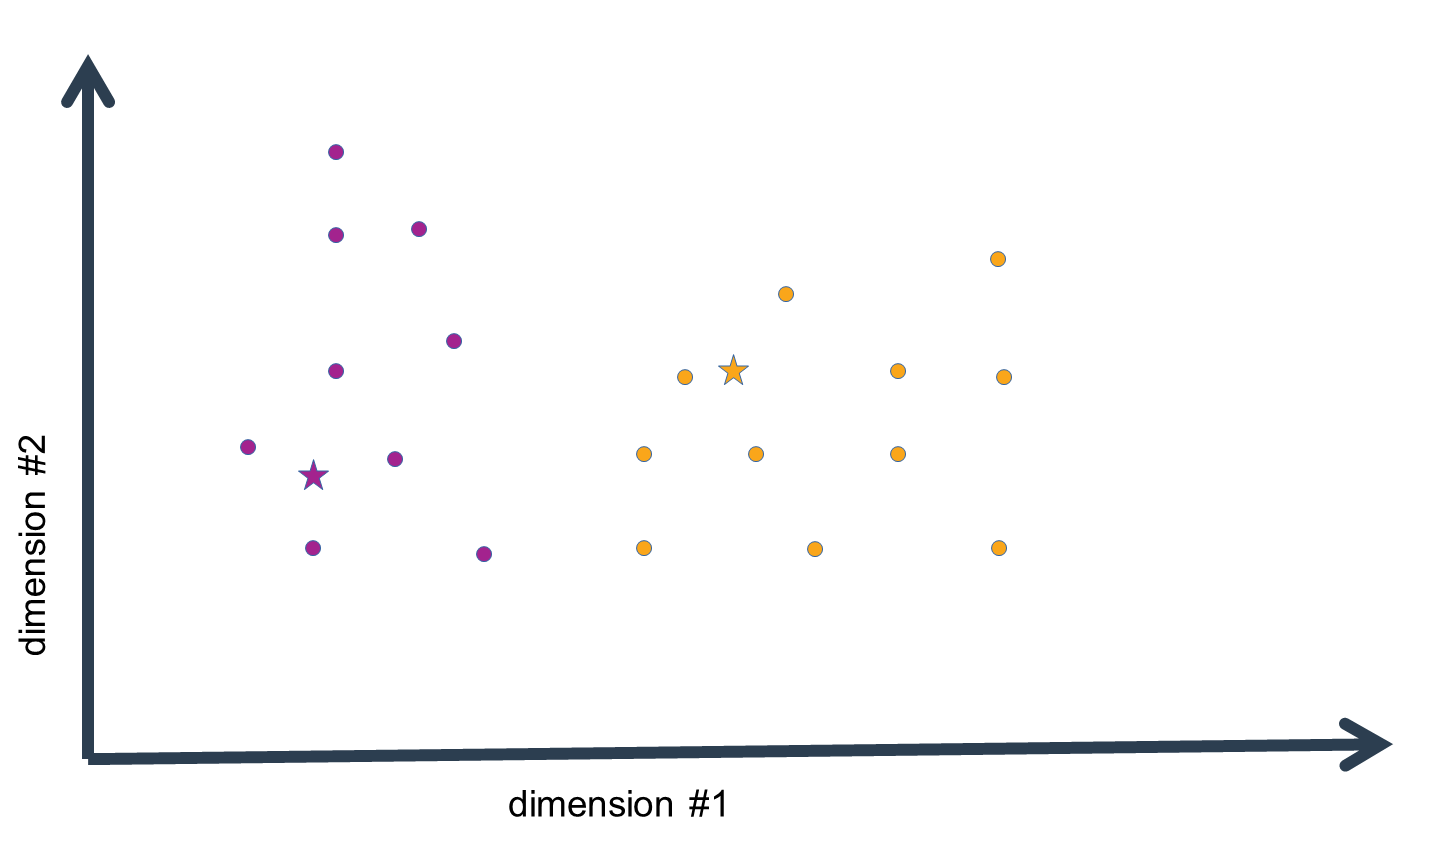
What has happened is that the cluster-mean estimates have "moved" through the n-dimensional space occupied by the
given data, until they have reached a point where the differences of the data-points assigned to them has
become quite small in sum. This is often described as the algorithm having "converged" on a final solution.
This terminology is quite common to data science and statistical modeling. Usually, models or algorithms
converge on a
Now, what about the uncertainty in the number of clusters to be set in the beginning? Well, one way to diagnose if you have set the number of clusters too high is to run the algorithm a few times, always with different initial guesses for the cluster means. If the number of clusters you set is good, then the outcome of the clustering will always be rather similar, i.e. the data grouped together in a cluster will always be more or less the same. If the outcome is highly variable between different initializations, the number of clusters you set is probably off, and you should consider reducing the number of clusters.
If the number of clusters you set is much over-estimated, then the K-means algorithm may be interrupted with an error, since at some point no data-points at all will be assigned to some cluster-mean estimates, and these cluster means will turn into NaN vectors. We can circumvent this by simply dropping those cluster-mean estimates that are NaN vectors, thereby reducing the number of clusters as the process continues.
K-means clustering works well for relatively simple data, i.e. data of a one-dimensional data structure. Images, for example, which have a two- or three-dimensional data structure, may not so easily be clustered. These require e.g. Convolutional Neural Networks for clustering, i.e. models that account for the spatial relationships between the dimensions of the data. Data with highly correlated variables may also produce insufficient clustering results when applying K-means clustering.
An implementation of the K-means clustering algorithm on the